

With the evolution of social media and instant feedback, brand reputation has become fragile. A single viral post, whether positive or negative, can shape perceptions for years. However, with sentiment analysis, you can stay one step ahead.
Media Watcher’s sentiment analysis is one of the tools that provide real-time insights to build authenticity into how people feel about your brand, track sentiment score, and even predict potential risks before they snowball.
With this kind of intelligence, managing your brand’s reputation becomes less about firefighting and more about strategic brand building.
Let’s explore how Media Watcher analyzes and interprets sentiment.
How Sentiment Analysis in Media Watcher Works?
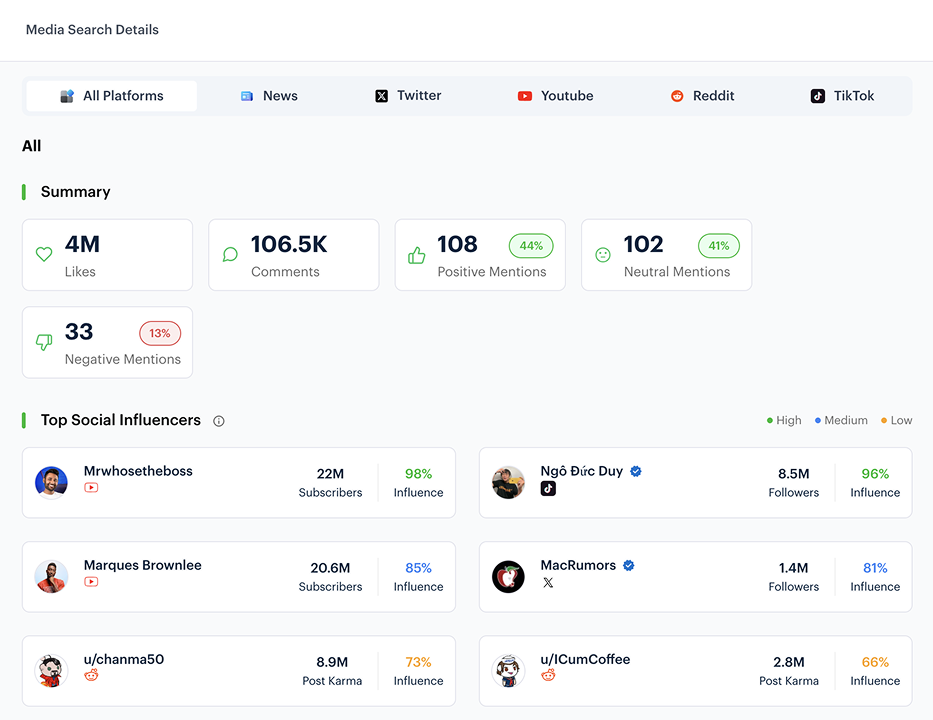
The first step in using Media Watcher for business and brand building is to search using a specific keyword, such as your brand name, product, or any topic you want to monitor. Once you enter the keyword, you have several options to fine-tune your search.
You can filter mentions by sentiment (positive, neutral, or negative), adjust the content volume per platform using a slider, and choose the country and language of the mentions.
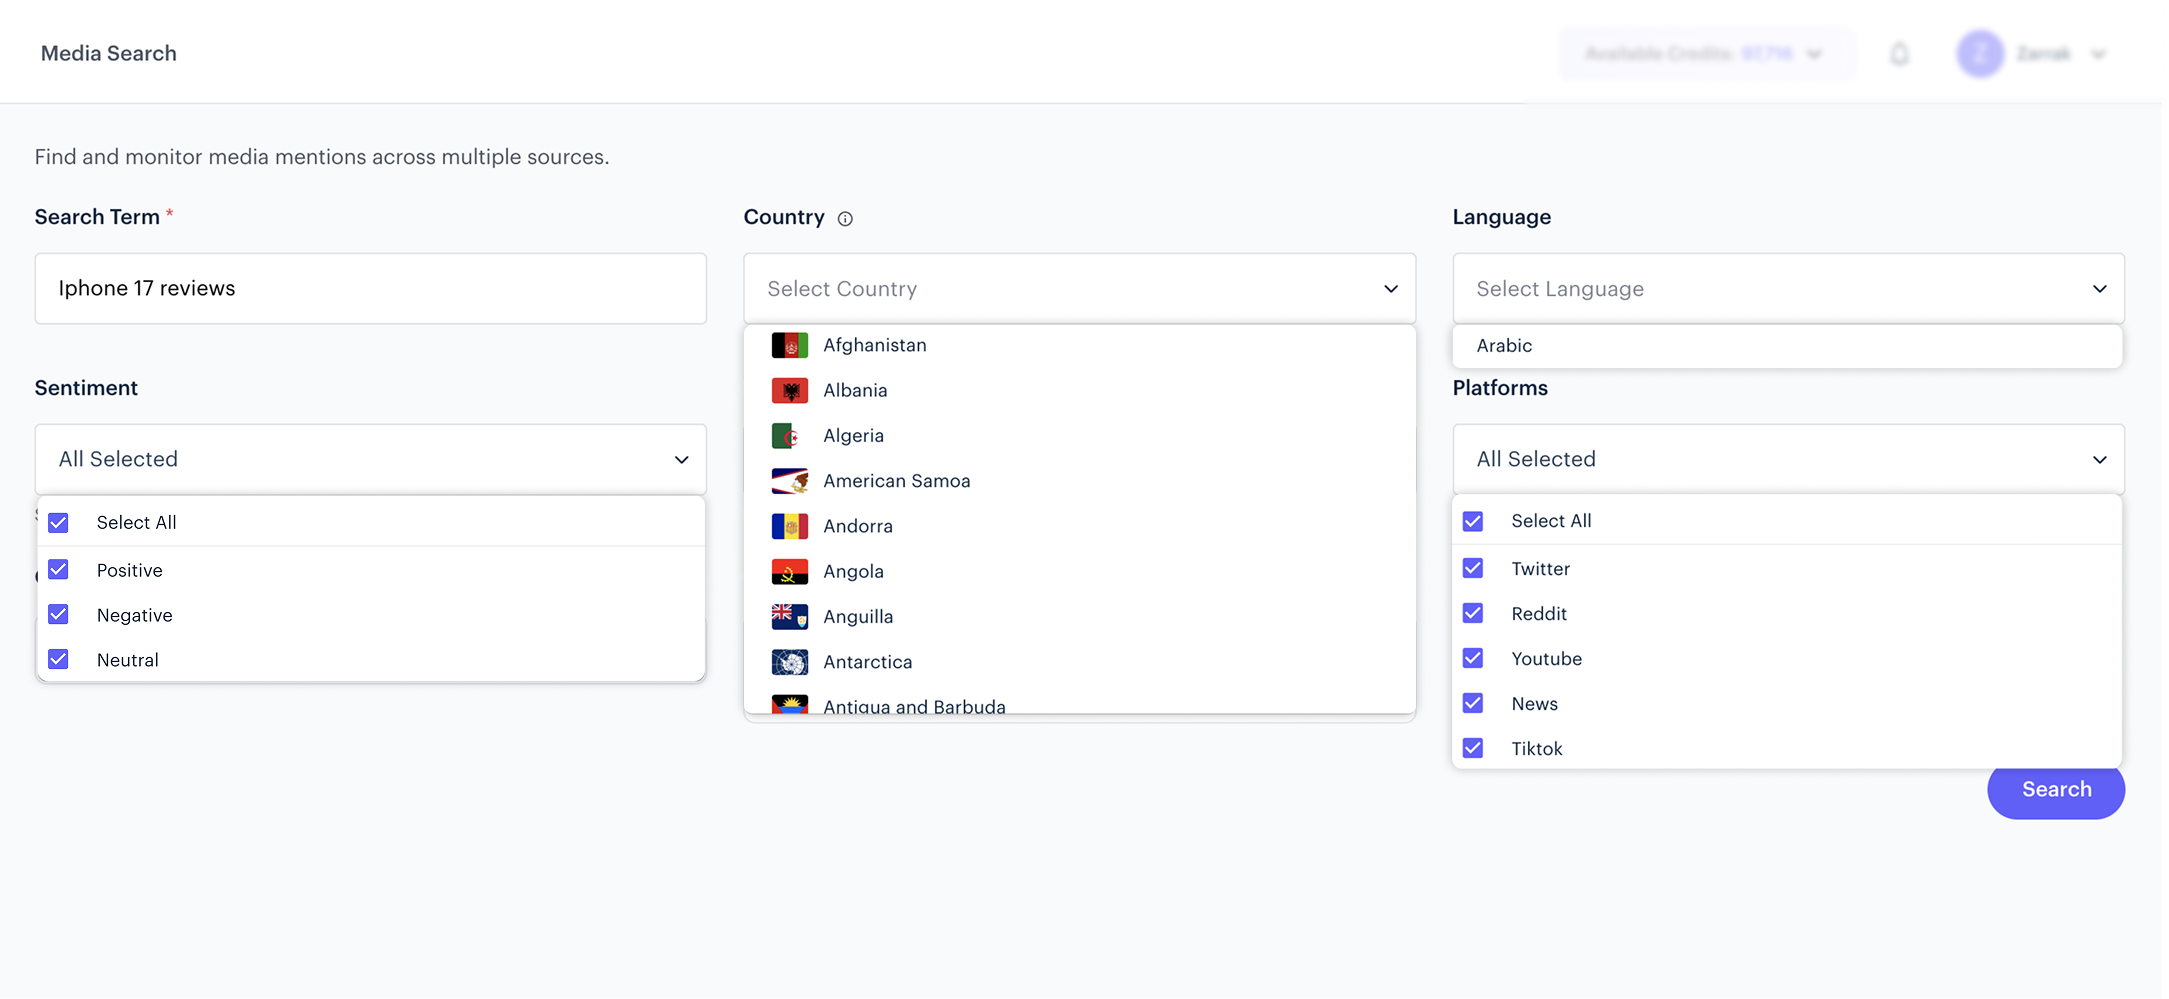
Moreover, you can select the publication date to narrow your results to specific time frames and choose which platforms to monitor, such as social media, news outlets, or forums.
Another specification includes continuous and real-time tracking of your search term, which can be simply enabled through the ongoing monitoring section. These options allow you to customize your search to get the most relevant and actionable insights for your brand.
Now, let’s break down how we can analyze sentiments from the dashboard.
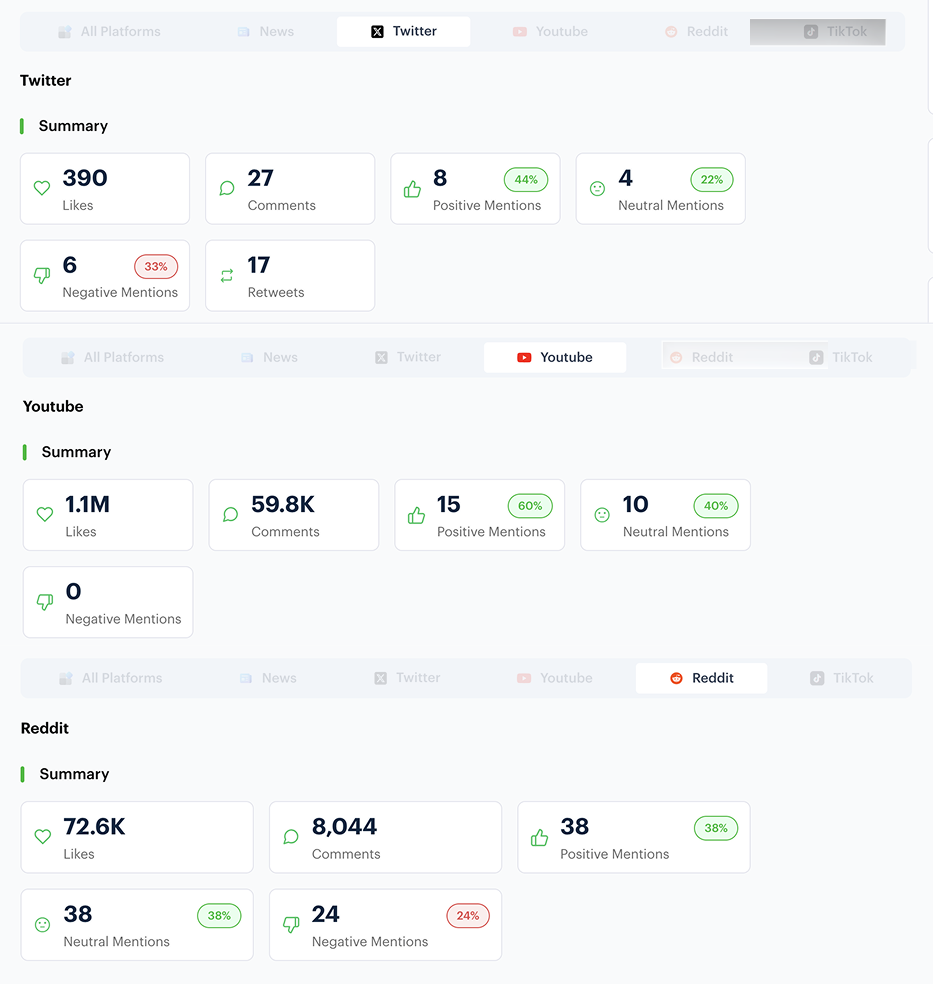
Sentiment by Platform
The sentiment by platform section breaks down the overall mentions and how people feel about your brand on each channel.
It typically presents a visual comparison, such as a bar chart of positive, negative, and neutral mentions across platforms like Twitter, Facebook, Instagram, forums, and news.
This allows you to see where sentiment is strongest or weakest for your keywords. For example, one might find that Twitter has a higher share of negative mentions while Instagram is mostly positive. Brands can use this insight to prioritize responses on the platform with the most negative sentiment.
In practice, Sentiment analysis by the Platform section helps pinpoint which channel needs attention. If one platform’s bar shows an outsized portion of negative chatter, you know where to focus your engagement first.
Likewise, if a particular network is overwhelmingly positive, you might decide to amplify content there or leverage those happy audiences for advocacy.
Social Platform Comparison
The social platform comparison section of this media intelligence software shows how different social networks compare in activity and mentions for your tracked keywords or event.
Instead of focusing on sentiment ratios, this section of the dashboard compares overall performance metrics across platforms.
You’ll see which platforms generate the most mentions, discussions, or reach for your brand. For instance, you might discover that 44% of all online mentions come from Twitter while only 10% come from other forums on the internet.
Therefore, in a single view, you can gauge where the conversation is happening the most.
This comparison is extremely useful for event monitoring. If you’re running a campaign or managing a crisis, it tells you which social site is the primary hub of conversation.
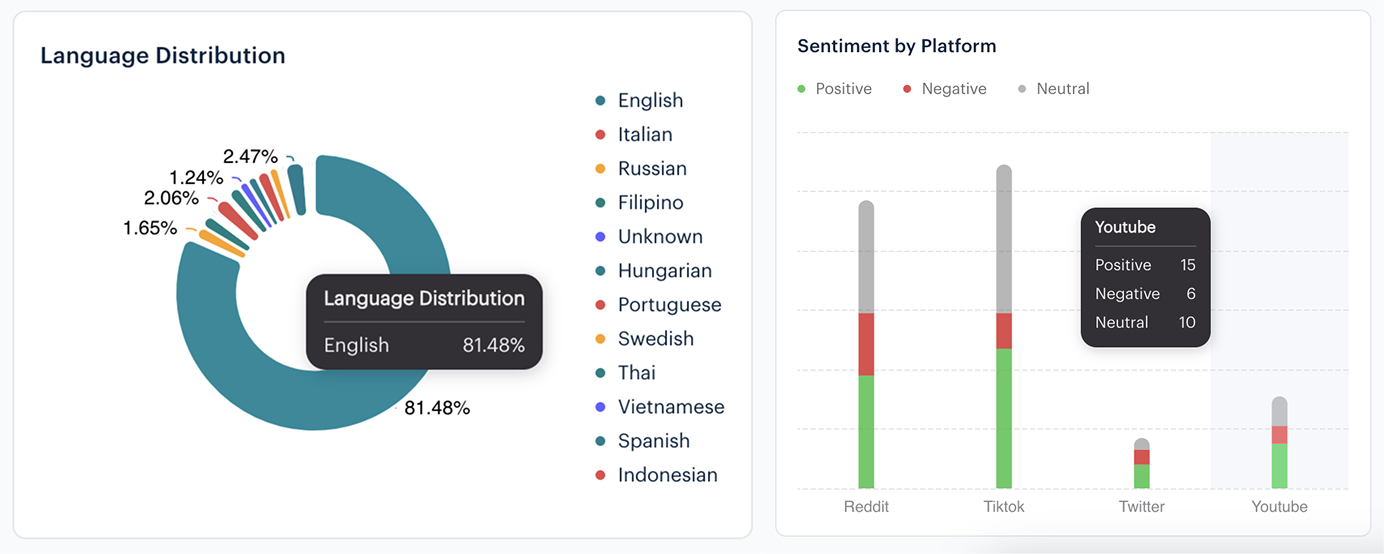
Language, Country, and Sentiment Distribution
This particular section provides a geographic and linguistic breakdown of your mentions, combined with sentiment insights.
Language distribution shows what languages people are using when talking about your business or related campaign, while the country distribution reveals from where those mentions originate.
These are often presented as maps or tables that show that 40% of mentions are in English, mostly from the US and the UK, and 20% in Spanish, concentrated in Spain and Latin America, etc.
Each region or language can also be color-coded by prevailing sentiment.
Media Watcher’s sentiment monitoring tools allow you to segment data by geography and language, and even show tone distribution by language, meaning you can see if the sentiment in one country skews more positive or negative.
For a brand, these insights are incredibly practical. If you’re monitoring a global product launch or a worldwide event, you can quickly grasp where it’s a hit and where it’s facing issues.
Language and country distribution also help with keyword monitoring for international brands, as you can detect if an issue is emerging in a specific region or if a campaign slogan is being misinterpreted in another language.
Mention Volume Timeline
While the sentiment analysis process focuses on the tone, the mention volume timeline focuses on the sheer volume of discussions over time on the internet.
It’s a simple timeline chart displaying the number of mentions per time interval, day/hour, regardless of sentiment. This section highlights highs and lows in the overall conversation.
For example, you may see a massive spike in mentions on the day of a big event or right when a news story breaks about your brand.
Monitoring mention volume is a straightforward way to gauge public interest and engagement levels.
This section identifies when people are talking about a brand or a specific keyword the most. If you ran a marketing campaign, this graph will show the buzz it generated and how long that buzz lasted.
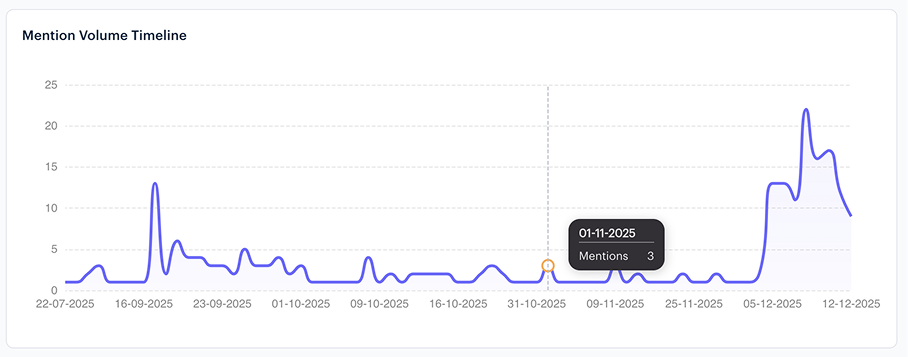
In essence, the mention volume timeline helps brand managers pinpoint the exact moments that deserve a closer look, so they can dive in and understand what drove the surge or dip in chatter.
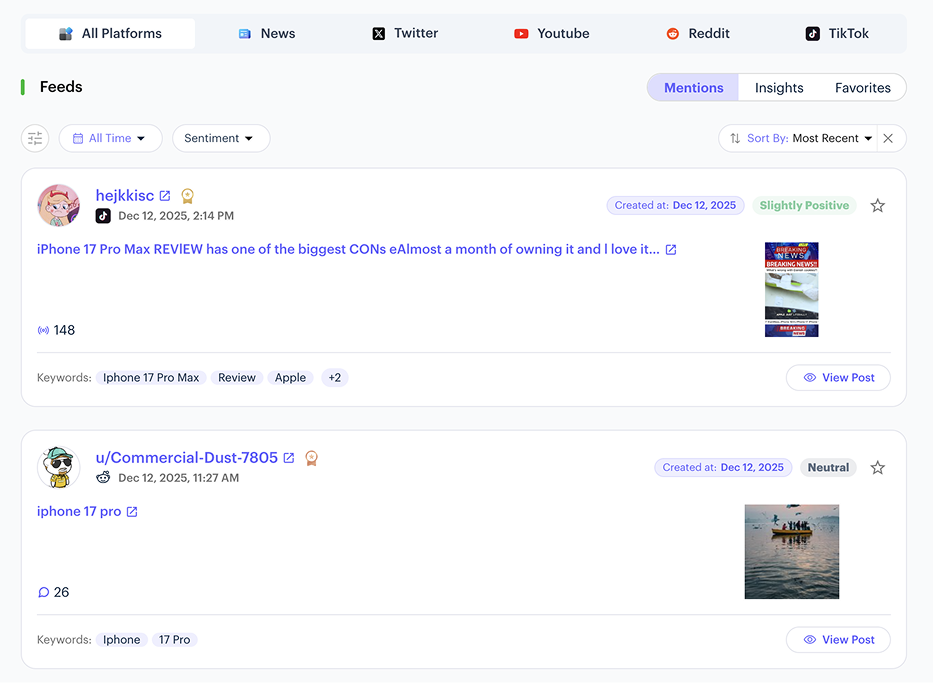
Mention Feed To Track Social Mentions
The Mention Feed is the live stream of individual mentions pulled in by the monitoring system. Think of it as the raw data behind all those charts, that is, every tweet, post, news article, or comment that contains your tracked keywords. It all appears here, typically in reverse chronological order.
The feed is interactive and filterable, allowing you to narrow results by criteria such as sentiment, platform, keyword, or timeframe.
For instance, you could filter the mention feed to only show negative mentions on Facebook from the last 24 hours, if you want to examine a specific issue in detail.
This section is where a brand’s community managers or customer support might spend a lot of time. It allows you to read exactly what people are saying in context.
Moreover, brands use the feed to spot notable posts, which may include a trending tweet from an unhappy customer or a news piece gaining traction, so they can respond or engage quickly. It is also useful for gathering real quotes and feedback.
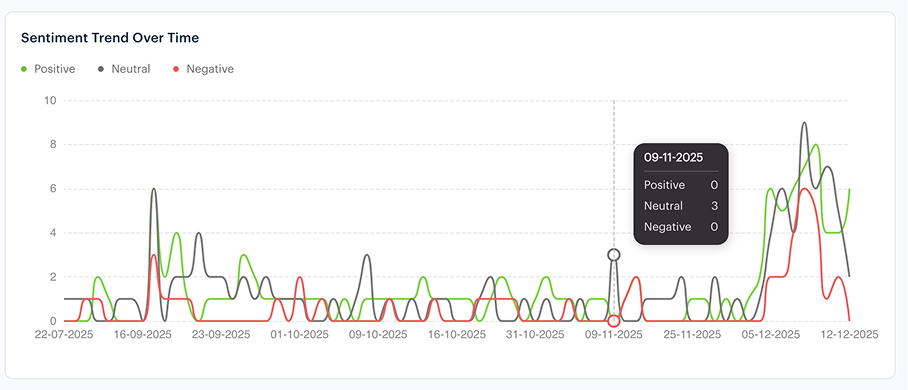
Sentiment Trend Over Time For Crisis Management
The Sentiment Trend Over Time panel is your timeline view of public opinion. It typically presents a line chart plotting sentiment that is positive, neutral, or negative on the y-axis against time on the x-axis, that is, days, weeks, or hours.
This lets you watch how sentiment evolves and spot patterns or sudden changes.
Each spike or dip can be aligned with real-world events.
For example, if you see a sharp increase in negative sentiment on a particular date, you can correlate it with what happened that day, perhaps a bad review went viral or a service outage occurred.
Annotations or markers often highlight these key events on the chart, helping you connect the timeline to actual causes.
For brands, sentiment trends over time are essential for campaign and crisis monitoring. You can use it to evaluate whether a new product announcement is being received well or to detect early warning signs of any issue.
By tracking sentiment trends, marketers and other teams can also measure the impact of their actions over time.
For example, if you implemented damage control after a negative wave, this graph will show if sentiment improved in the following days.
In short, this section helps you answer “how are people feeling about us right now, and how has that changed since yesterday or last week?”
Why Brands Should Get Media Watcher’s Sentiment Analysis Tool?
Sentiment analysis by Media Watcher is invaluable for brand building. By continuously tracking how your brand is perceived across platforms, you can adjust your strategy in real time, address potential issues before they escalate, and capitalize on positive sentiment to grow your brand.
Moreover, Media Watcher provides real-time insights, trend visualizations, influencer analysis, crisis alerts, and region-specific sentiment tracking, giving you complete control over how your brand is perceived.
It transforms raw conversations into actionable insights, helping you refine campaigns, protect your reputation, and strengthen brand loyalty.
Contact the Media Watcher team and book a free demo today!